
| CONTENTS | GLOSSARY | SUBJECT INDEX | SEARCH DOCUMENTATION |
LSP-PIC-formatted files read by SPECT3D contain data from LSP particle-in-cell simulations. These data are contained in arrays that are identified through the use of "variable names." SPECT3D can be used to display data from 1-D and 2-D PIC data files.
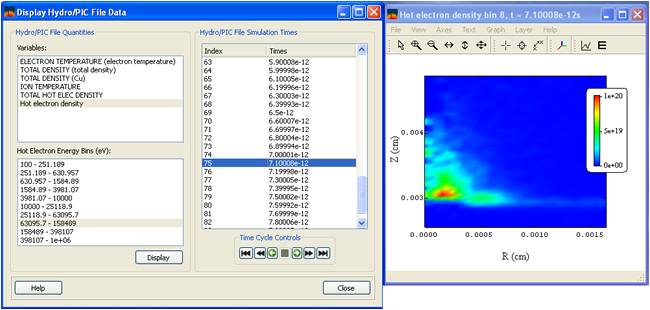
To display data from a PIC data file, select Display | Hydro Data. A list of available variable names is shown in the upper left box of the display widget.
A list of the energies corresponding to the kinetic energy of hot electrons (i.e., the non-Maxwellian component of the electron distribution) is shown in the lower left box. These energies correspond to the mean values of energy bins.
A list of simulation times at which data was written to the PIC file is shown in the right box.
To view a plot of the data, select a variable name and select a simulation time. When viewing an energy-dependent Hot Electron Density, also select an electron kinetic energy from the lower left box. (A sample temperature plot is shown below.)
A separate plot window is used for each quantity. When a new simulation time is selected, the plot data of all quantities being displayed are updated automatically.
For information on how to modify the plot parameters or save data and/or images from the graph, see the PrismPLOT Users Guide.
A set of Time Cycle Controls is shown below the list of simulation times. These are used to facilitate stepping through the list of simulation times.
The functionalities of these buttons are (from left to right):
| Copyright © 2024 Prism Computational Sciences, Inc. | SPECT3D 20.5.0 |